Did you know? Heatmaps provide concrete data to support design and content decisions, leading to more effective website optimization. (Source)
Understanding how visitors engage with your site is essential for making improvements. Heatmaps and user-behavior data let you see where users click, where users scroll, and how long users spend in different areas of the page.
All of these are extremely useful insights into what attracts the user’s attention and what gets ignored. From these visual insights, businesses can identify friction points, improve navigation, and influence where high-performing content is recommended.
While there are many potential ways to use data-driven changes, in regard to actionable results, the best approaches are perhaps still in improving call-to-action buttons, and strategic page layouts that have been tested in the past for higher engagement. Or designing page elements that can lead to increased interaction.
With these tools, you will always make a more responsible decision instead of trying to guess, which will ensure that any changes to your site will leverage user experience and deliver the results you want.
In this blog post, we are going to explore this concept more deeply, giving numerous insights to the readers.
Let’s begin!
Key Takeaways
Understanding everything about heatmaps in web optimization
Exploring their distinctive behavior
Discovering the role of screen recording and mouse movement
Uncovering numerous insightful benefits
Understanding Heatmaps in Website Optimization
The heatmaps are the visual aids that show where customers are seeing, clicking, moving, and scrolling on the web page. They are color-coded, where warmer colors such as red and orange represent an area of heavy interaction. On the flip side, the cooler shades like blue show spots where not much is happening or even nothing at all. This helps companies quickly figure out which sections of a page are getting the most love and which ones are totally being ignored by users.
By using heatmaps, businesses can assess if users are engaging with the content they intended to highlight. As an example, when a critical button that engages the technology in the call-to-action is in the cold zone with little room of interaction, this will indicate that it perhaps needs to be moved. Heatmaps eliminate hazards to guesswork on the design process providing teams with the ability to make data-driven changes while making a direct impact on user experience and engagement.
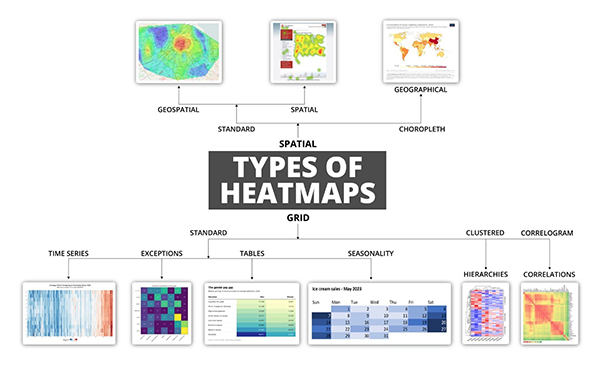
Intriguing Insights This infographic shows different types of heatmaps
Analyzing Click and Scroll Behavior
Click tracking heatmaps show where customers are clicking on a page. Such insights can be very valuable information as far as the functionality and meaningfulness of the navigation elements are concerned and whether they are distracting the user with the non-clickable features. When an unlinked image or text receives repeated clicks by visitors, it means that there is something wrong because they may be confused or deceived with the design. This would go towards identifying the friction points and smoothening areas that a user can click easily.
Heatmaps on scroll behavior show the point at which the users are scrolling down and bouncing. When vital content or action is difficult to access for the majority of site users, the layout should be redesigned. Being aware of how content is consumed enables users to prioritize what information needs to remain on top and do not bury anything that is important messaging.
Interpreting Session Recordings and Mouse Movement
Along with heatmaps, session recording provides real-time information on user actions. The recordings will enable you to observe real settings being followed by the real visitors, so it will inform you where users stop, wait, or move their cursor in a random way. They can reveal usability problems, confusion, or even technical breakdowns that will not be included in the regular analytics reports.
Although tracking mouse movement is not as accurate as eye tracking, it can be significantly associated with the area where humans are looking most of the time. It is possible to tell how people are moving with their mouse and this can give a key to know whether they are reading or just surfing the page. When combined with heatmaps, session recordings provide additional context for user interactions.
Interesting Facts Heatmaps track how far users scroll, how long they spend on specific elements, and how they navigate the site, providing valuable insights into user engagement. (Source)
Making Design Improvements Based on Data
Businesses will be able to test novel designs with greater certainty, using heatmaps and information about their behavior. As an example, A/B testing a new layout of the landing page will work even better when it is combined with heatmap information. The new arrangement supports continuous change when it shows increased interaction in key divisions. The implementation of this iterative approach to design will allow optimizing the user journey in steps.
Moreover, the insights tend to illustrate aspects that should be more straightforward or important. These include tidying a busy homepage, making a button more visible, etc. But all these small characters add to the overall improved user experience. The best digital marketing agency in Canada tends to incorporate the element of heatmap analysis in the context of a more extensive digital approach.
Boosting Conversion Rates and User Engagement
Among the key objectives of examining user behavior, it is important to note that it helps grow conversions. This is done so that you can see where a user is drifting off or losing focus, whether they are signing up for an email, making a purchase, or even asking for a quote. Heatmaps show business owners where precisely the engagement is lacking so that the problem can be resolved as soon as possible.
With increased involvement, the user will also likely share, come by again, and become long-term clients. Ease of use decreases frustration and creates trust, which is particularly useful to e-commerce and service-based businesses. An AI SEO reseller who is interested in raising the performance of its clients will do well to suggest the inclusion of heatmap and behavior analysis in an entire optimization package to the clients.
Integrating Insights with Broader Marketing Strategies
Heatmap and data on user behavior should not be utilized separately. These findings really shine when they’re part of a bigger marketing and SEO strategy. By looking at both user behavior and search engine data, businesses can boost their visibility and effectiveness at the same time. For example, knowing which landing pages keep users engaged and lead to conversions can help fine-tune SEO efforts.
With user behavior-driven designs being made better user satisfaction and subsequently better business results are achieved. The returns on marketing efforts are great when the content is within the intent of the user and easy navigation is facilitated by design. Teams that actively utilize heatmap information tend to experience a rise in the performance of both the paid and the organic channels thereafter.
The heatmaps and information about user behavior give a strong view on the way the visitors engage with your site. With this knowledge of where the users are clicking, scrolling and moving the mouse, one can make specific placements that will improve on the usability and result in conversion. They enable you to design to actual user requirements as opposed to fiction and so get your site to be both more usable and easier to comprehend.
Frequently Asked Questions
Ans: Heatmaps are used in various forms of analytics but are most commonly used to show user behavior on specific web pages or webpage templates. Heatmaps can be used to show where users have clicked on a page, how far they have scrolled down a page, or to display the results of eye-tracking tests.
Ans: Heatmaps are an excellent visual tool for understanding user behavior and optimizing your website for better engagement and conversions.
Ans: Heatmaps are color-coded visual maps that overlay a page to show where visitors or viewers click, tap, hover, and scroll, instantly revealing high- and low-engagement areas you can optimize for usability and conversions. Heatmaps can be created manually, but most are generated by heatmapping software.